Some Good News: Rents Have Finally Peaked As Rental Market Enters “Widespread Cooldown”
Some Good News: Rents Have Finally Peaked As Rental Market Enters “Widespread Cooldown”
Back in August, when the so-called experts (including the career economists at the Fed) were still convinced that inflation was transitory, we showed that realty was far scarier as true rents were only just starting to trickle through to the various CPI and PCE metrics, and while Owners’ Equivalent Rent of residences, which makes up almost a quarter of the consumer price index, rose just 2.4% in July from a year earlier according tot he Fed, the real number – as divined from real-time national rent indicators such as that from Apartment List and Zillow – was much higher, perhaps as much as 5%. The OER figure “lags the reality” because it’s based on a survey of homeowner expectations about what their home would rent for, said Mark Zandi, chief economist for Moody’s Analytics
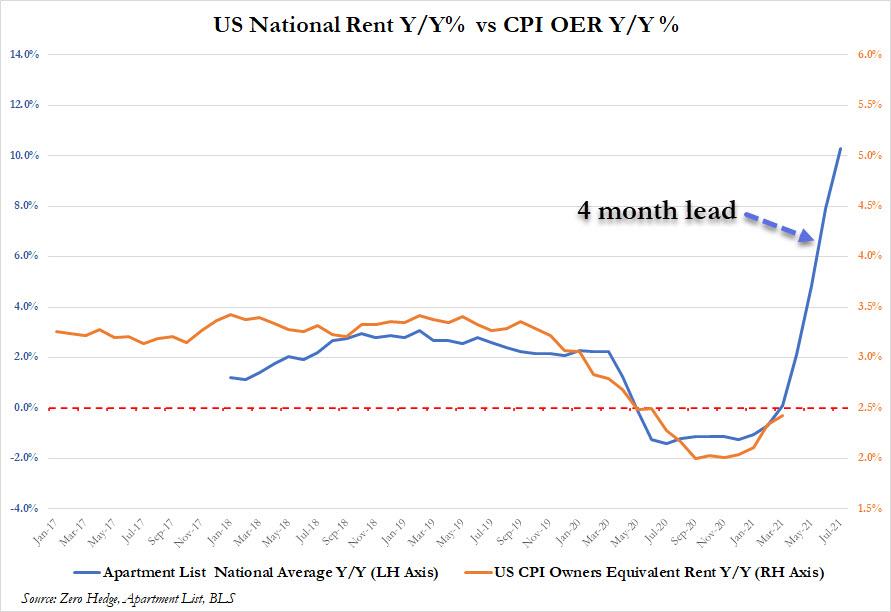
Fast forward to today when OER is now far higher, with shelter inflation having surged to 4% and rent inflation close behind…
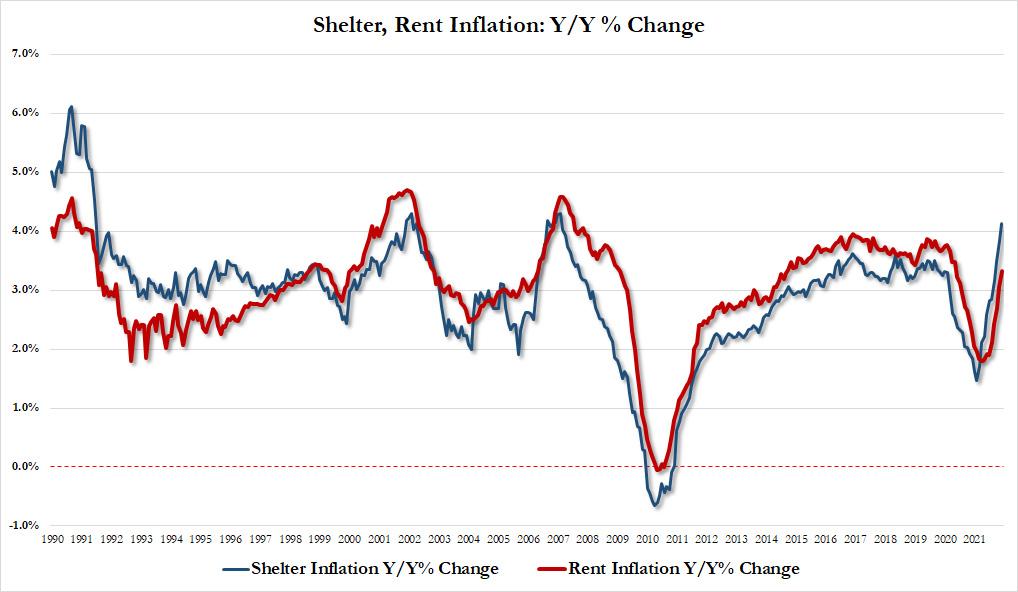
… both numbers which still have a long way to go as they catch up to real prices.
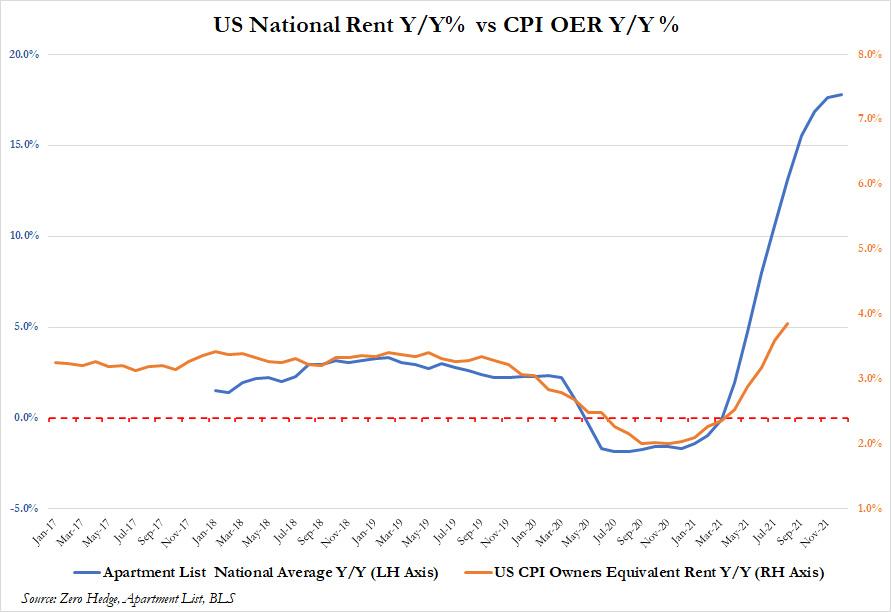
But here we have some good news, because while the rent, shelter and OER prints reported by the CPI will still rise for the next 5 or 6 months, the actual rental market has now finally peaked.
According to the latest Apartment list data, the consultancy’s national index fell by 0.2% during the month of December, marking the only time in 2021 when rents declined month-over-month. And while a slight dip in rents at this time of year is typical of seasonality in the market, it’s especially notable after a year of record-setting growth, especially when considering that over the course of calendar year 2021, the national median rent increased by a staggering 17.8%. To put that in context, annual rent growth averaged just 2.3% in the pre-pandemic years from 2017-2019.
As the chart below shows, December is also the fifth straight month in which monthly rent growth slowed after peaking at 2.7 percent in July. The current slowdown is capping a year that has been characterized by unprecedented price increases. For seven months from March through September, month-over-month rent growth exceeded the pre-pandemic record going back to 2017. In December, however, rent growth fell in line with pre-pandemic trends – rents also fell by 0.3 percent in December 2019, and by 0.2% in December 2018.
Drilling into the December data, 61 of the nation’s 100 largest cities saw rents fall this month, indicating a widespread rental market cooldown. This can be seen in the chart below, which visualizes monthly rent changes in each of the nation’s 100 largest cities from January 2018 to present. The color in each cell represents the extent to which prices went up (red) or down (blue) in a given city in a given month. The band of dark red in 2021 depicts this year’s massive rent boom, which peaked in July and August 2021 when all 100 cities in this chart saw prices go up. As we closed out the year, the three rightmost columns show that the recent cooldown in rents is also geographically widespread.
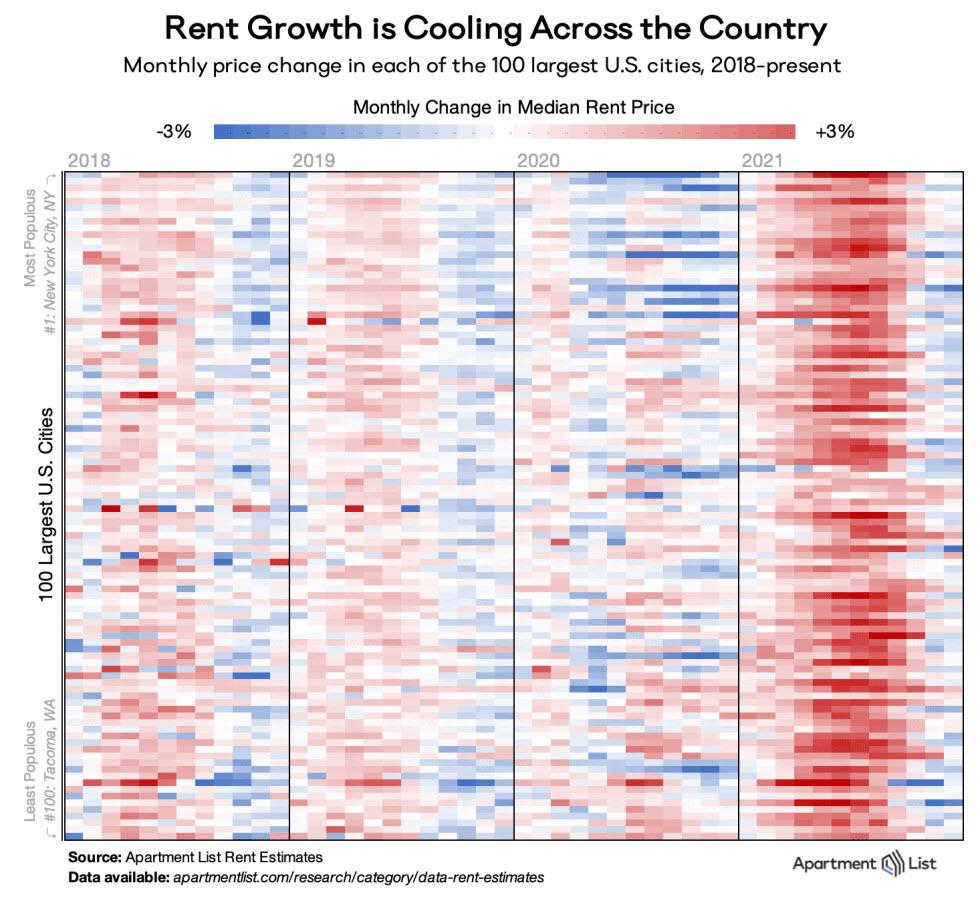
Steady rent declines have occurred in a wide variety of places. Prices have dropped for three consecutive months in some of the smaller cities that saw massive influxes of new residents throughout the pandemic, including Boise ID, Fresno CA, and Reno NV. But similar price drops have also taken place in larger urban centers like Boston MA, San Francisco CA, and Chicago, IL. Meanwhile, rent increases have persisted in warm-weather cities across the Sun Belt, like Orlando FL, Tucson AZ, and Dallas TX. Here, rent growth decelerated but remained positive throughout the last several months of 2021.
In particular, Seattle and San Francisco both landed in the top five for largest month-over-month declines, signalling that these pricey tech hubs may be entering a second phase of COVID-related rental market softness.
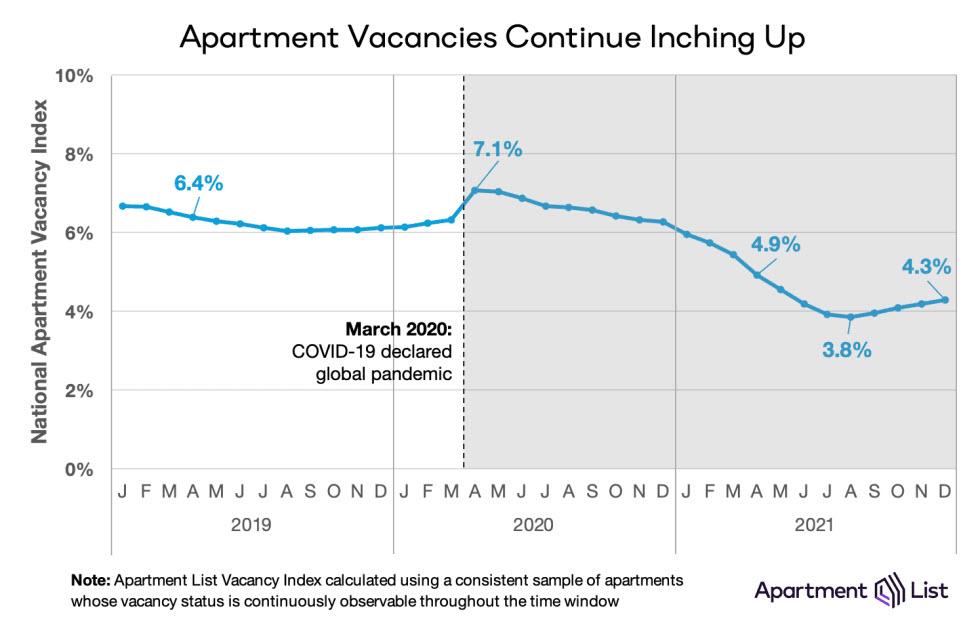
Separately, the Apt List national vacancy index ticked up again for the fourth straight month, as we enter 2022 amid an easing of the tight market conditions that characterized 2021. Indeed, the Apt List vacancy index spiked to 7 percent last April, as many Americans moved in with family or friends amid the uncertainty and economic disruption of the pandemic’s onset. After that, however, vacancies began a steady decline, eventually falling to 3.8 percent in August 2021. Subsequent to this, the vacancy index has ticked up slightly for four consecutive months and stands at 4.3 percent at the end of the year. Although the recent vacancy increase has been modest and gradual, it represents an important inflection point, signalling that tightness in the rental market is finally beginning to ease. If the vacancy rate continues this trend in the coming months, it’s likely that rent growth will also continue to cool further.
In conclusion, after a year of astronomical price increases, December 2021 finally brought some relief to the rental market. The Apartment List national rent index spiked nearly 18% in 2021 but fell 0.2% in December, a modest dip but the first such decline observed in over a year. While the apartment market remains tight – the national vacancy rate sits just above 4% compared to 6% pre-pandemic – the winter season continues to bring signs that pressure is gradually beginning to ease. That said, it’s important to bear in mind just how much affordability has dissipated in 2021. 99 of the nation’s 100 largest cities saw rents jump more than 10 percent over the year, and the national median apartment cost eclipsed $1,300 for the first time ever. So despite a recent cool-down, many American renters will remain burdened throughout 2022 by historically high housing costs.
The bigger question is when will the BLS fed the latest real-time data into its CPI models, and how long until the Fed realizes that the rent inflation burst observed throughout 2021 is now reversing.
Source: Apartment List
Tyler Durden
Thu, 01/13/2022 – 18:00
Originally appeared on Read More
BREAKING NEWS
- Swiss Watch Exports Crash In China & Hong Kong

- Weak EV Market Dragged Down European Car Sales In March

- The Matrixxx Groove Show: Jeff and Shady slam Media Matters’ attack on their program – Brighteon.TV

- Report: U.S. and U.K. helped shoot down Iranian drones and missiles launched against Israel

- No escape from the meat grinder: Zelensky signs tyrannical mobilization bill that lets no man escape

- Poll: Republicans more likely to trust Trump for news on Russia-Ukraine conflict than mainstream media and government institutions

- Democrats alarmed by shift in voter identification ahead of 2024 presidential election

- World Health Organization official admits VACCINE PASSPORTS were a SCAM

- Iran threatens larger attack if Israel doesn’t back off with its aggression

- Psychotherapists announce plans to “eradicate” critics of transgender mutilation from medical profession

Leave a Reply